
AI in trading stopped being a futuristic concept a while ago: today it's an active tool behind how prices, technical indicators, and economic context get analyzed at scale in financial markets. This article explains, in simple terms, what's actually behind that idea — and how far it really goes.
Neural networks that learn from history
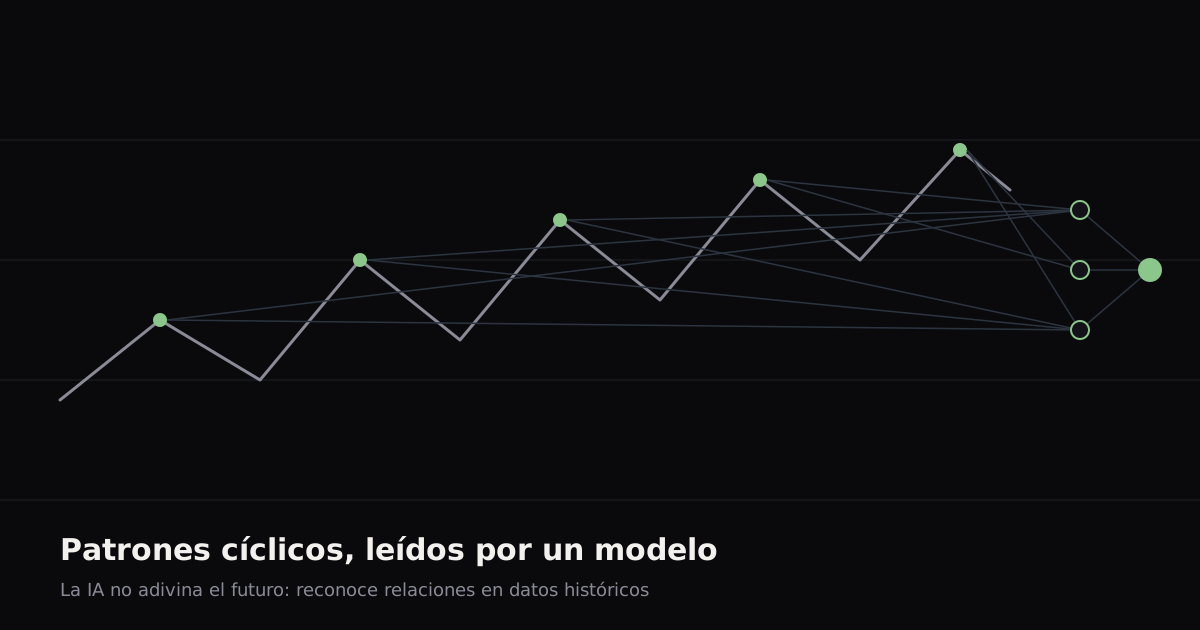
A machine learning model — like the LightGBM one DSprophecy uses — doesn't "guess" where a price is headed: it learns statistical relationships from thousands of historical examples, combining price, RSI, MACD, Fibonacci levels, and economic calendar data with what happened after each combination. The more market cycles a model observes during training, the more recurring patterns it can identify among those variables.
History doesn't repeat, but markets can still be cyclical
A core idea in technical analysis — summed up in the phrase, often attributed to Mark Twain, "history doesn't repeat itself, but it rhymes" — is that markets won't replay a past cycle exactly, but they do tend to show recurring behaviors: overbought and oversold zones, trends running out of steam, similar reactions near certain price levels. A model trained on enough history can recognize that kind of pattern more systematically than a manual, chart-by-chart review.
The real advantage: speed and precision, not fortune-telling
AI's most concrete contribution in this field isn't "predicting the future" — it's processing volumes of data that would be impractical to review by hand, in fractions of a second, with the same criteria every time. That's what makes it a relevant support tool for market analysis: more variables, reviewed faster, consistently.
An applied example: DSprophecy
At DSMarketLearning, DSprophecy applies exactly this approach: a model trained on price, RSI, MACD, Fibonacci, and the economic calendar generates a price forecast for NASDAQ 100, Gold, EUR/USD, and S&P 500, and each prediction is saved to be compared later against what actually happened — building a real track record of hits and misses over time, not an abstract promise.
On video
A quick summary of this same idea, on video:
This article is educational content, not personalized investment advice. Before making decisions, read our disclaimer.